
Applying the Roofline Model
What is it?
The recently introduced roofline model [2] plots the performance of executed code against its operational intensity (operations count divided by memory traffic). Unfortunately, to date the model has been used almost exclusively with back-of- the-envelope calculations and not with measured data. In this work [1] we show how to produce roofline plots with measured data on recent generations of Intel platforms.
Also check out our extended roofline model and plots.
Background
|
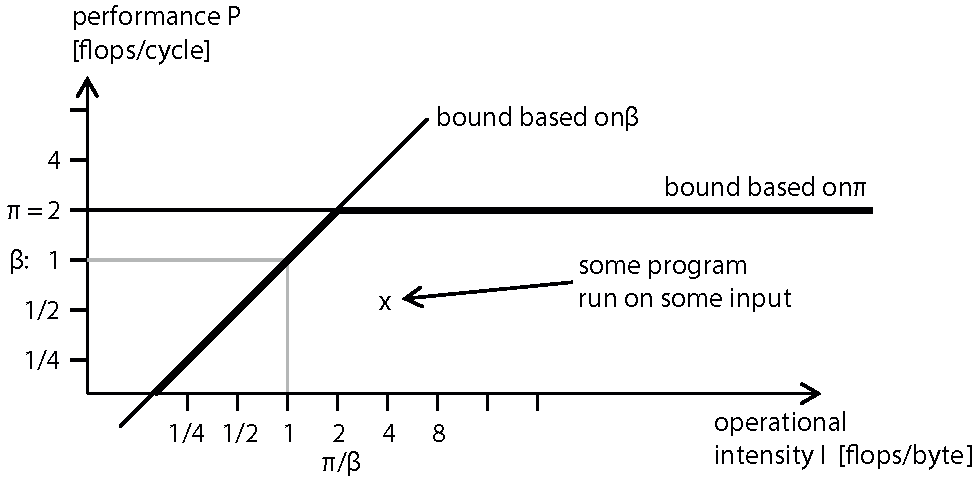
The roofline model includes two platform-specific performance ceilings: the processors peak performance and a ceiling derived from the memory bandwidth, which is relevant for code with low operational intensity. The model thus makes more precise the notions of memory- and compute-bound and, despite its simplicity, can provide an insightful visualization of bottlenecks. As such it can be valuable to guide manual code optimization as well as in education. The picture below sketches such a roofline plot for a platform with peak performance π = 2 flops/cycle and bandwidth β = 1 bytes/cycle. |
|
Experiments
We show, to this extent for the first time, a set of roofline plots with measured data for common numerical functions on a variety of platforms. In [1] we discuss which hardware performance counters we use to obtain the appropriate measurements and discuss caveats. Furthermore we guide the reader through the experiments we conducted and the insight gained from measured roofline plots.
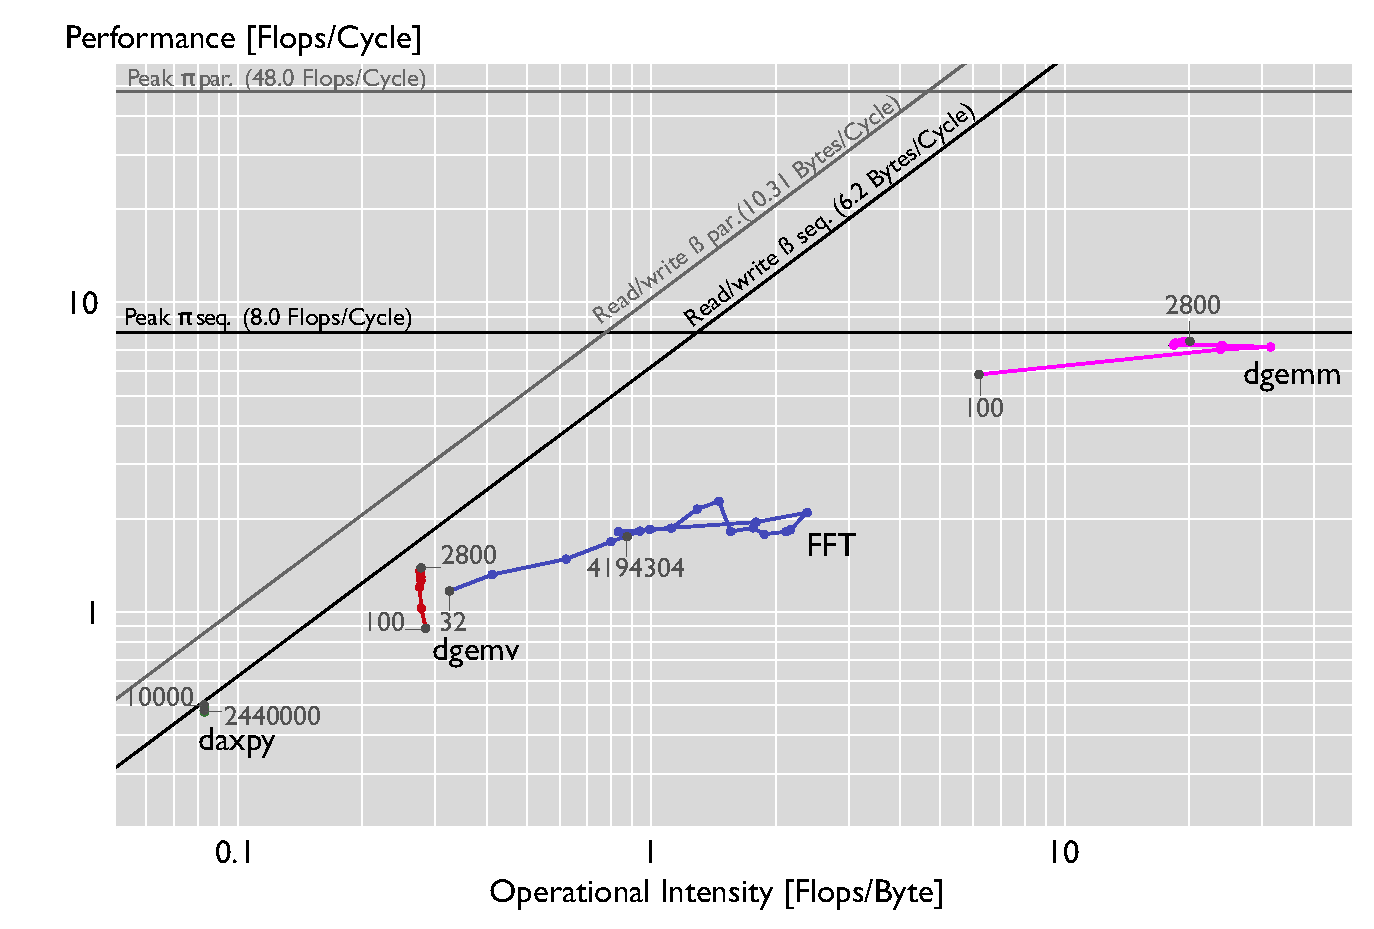
Different levels of BLAS and FFT from Intel MKL on a Core i7-3930K (Windows), single threaded |
|
|
We run a set of kernels that are known to have different operational intensities: the BLAS 13 functions and the FFT. The figure above shows the performance of the set of kernels when executed sequentially on a Core i7-3930K running Windows as OS. The set of input sizes n is chosen to use different levels of the memory hierarchy. For daxpy we use n = 10000 + 30000i*i, (0 <= i < 10), for dgemv and dgemm n = 100 + 300i (0 <= i < 10), and for FFT, n = 2k (5 <= k < 23). Daxpy and dgemv are memory- bound as expected, reaching about 95% and 90% of the peak. Dgemm is compute-bound for all sizes reaching also about 95% of the peak p. Note that the FFT is plotted with measured flops and not with pseudo- flops (fixing the op count to 5n log (n), an overestimation), as commonly done. |
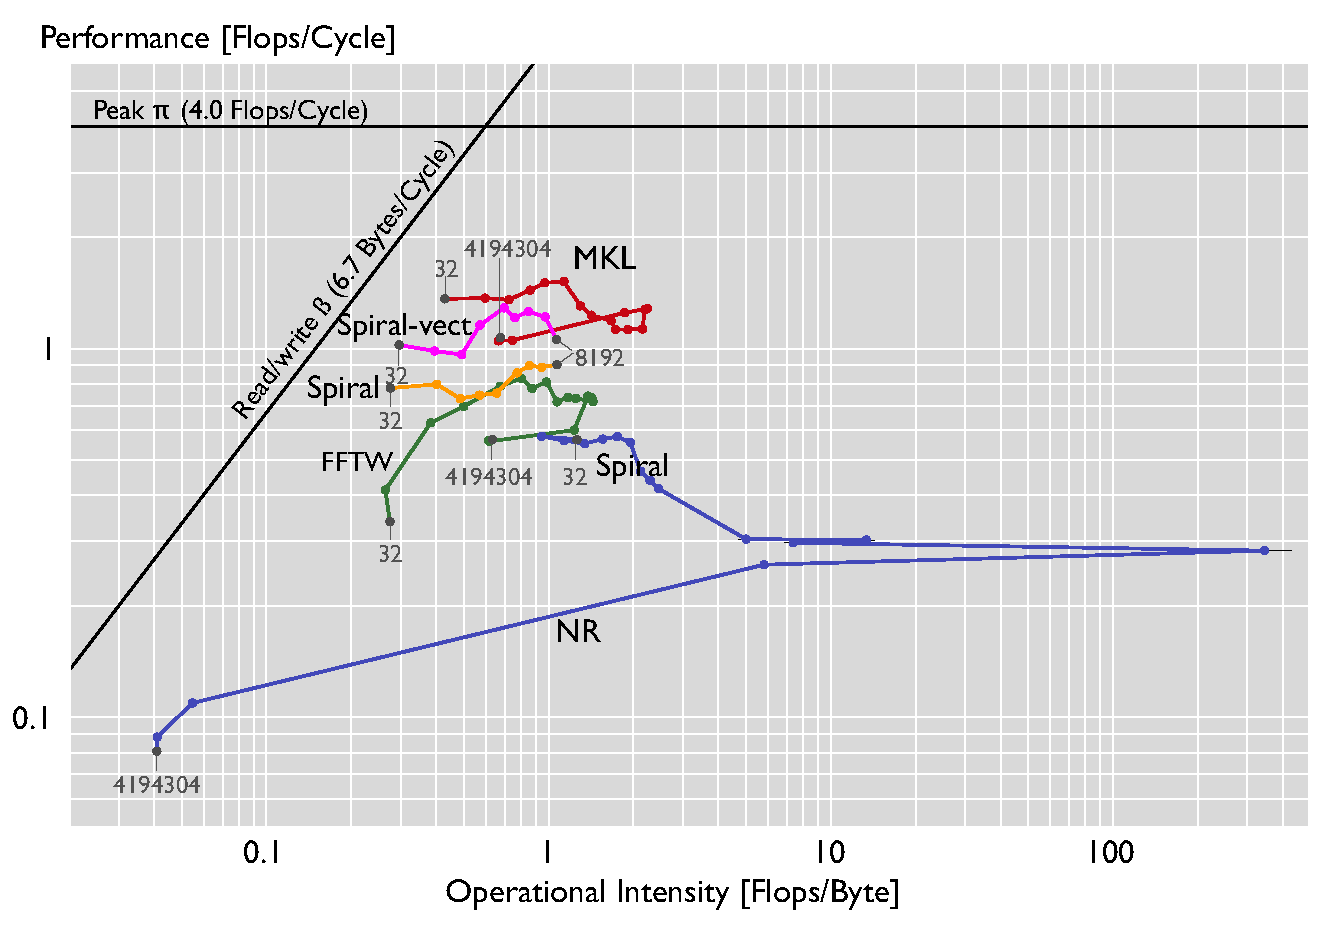
Comparing various FFT implementations on a Xeon X5680 (Linux) |
|
|
We compare various FFT kernels in the figure above. As in the previous plots, we use sizes n = 2k (5 <= k < 23), except for the Spiral-generated kernels where we use an upper bound of 4096 (the code aviable via the software section of the spiral.net page). The order of the kernels, in terms of performance, is roughly as expected, with MKL and one version of Spiral using the SSE instruction set, and the rest of the implementations being unvectorized. The only surprise is the performance of the straightforward Numerical Recipes code. The Numerical Recipes code seems to perform surprisingly well, due to the fact that it calculates the twiddle constants at runtime for all sizes, resulting in an increased flop count and thus increased performance and operational intensity. |
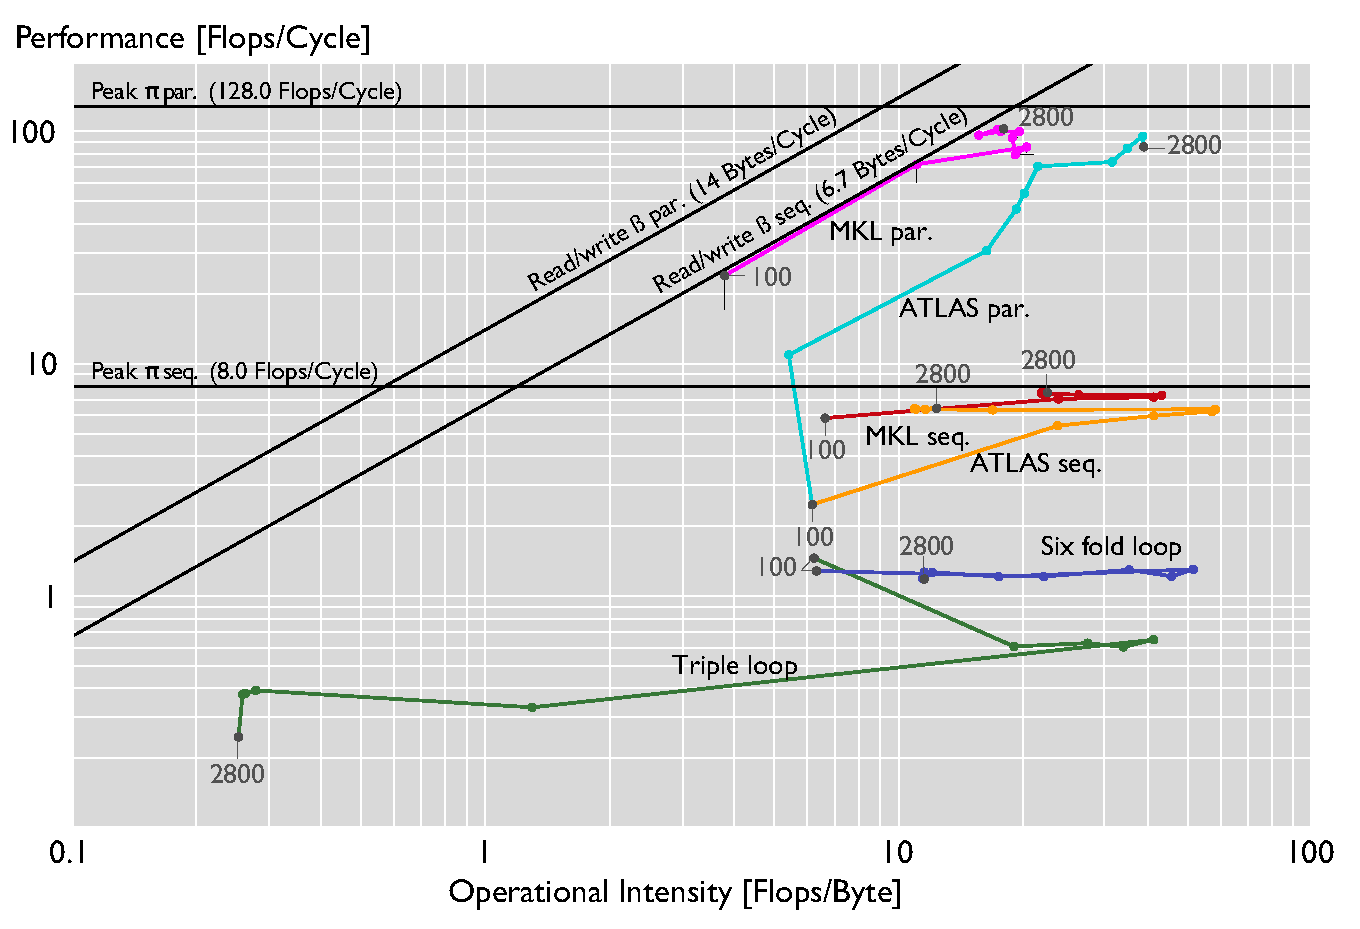
Comparing different optimization levels of MMM on a Xeon E5-2660 ( |
|
|
The figure above shows the roofline plot for the dgemm kernel at different levels of optimizations. In addition to ATLAS and MKL we consider a hand-coded standard triple loop and a six-fold loop obtained through blocking with block size 50. The MKL and ATLAS kernels provide improved ILP, SIMD vectorization, and multi-thread parallelism. |
Source code
The code used to generate these plots can be found here.
Also check out our extended roofline model, tool, and plots.
References
- Georg Ofenbeck, Ruedi Steinmann, Victoria Caparros, Daniele G. Spampinato and Markus Püschel
Applying the Roofline Model
Proc. IEEE International Symposium on Performance Analysis of Systems and Software (ISPASS), 2014, pp. 76-85 - Samuel Williams, Andrew Waterman, David Patterson
Roofline: an insightful visual performance model for multicore architectures
Communications ACM 55(6): 121-130 (2012) - Ruedi Steinmann
Applying the Roofline Model
Master Thesis ETH Zürich, 2012
Copyrights to many of the above papers are held by the publishers. The attached PDF files are preprints. It is understood that all persons copying this information will adhere to the terms and constraints invoked by each author's copyright. These works may not be reposted without the explicit permission of the copyright holder. Some links to papers above connect to IEEE Xplore with permission from IEEE, and viewers must follow all of IEEE's copyright policies.
More information
Contact: Georg Ofenbeck